

Monthly Budget vs Actual Variance Summary (YTD)
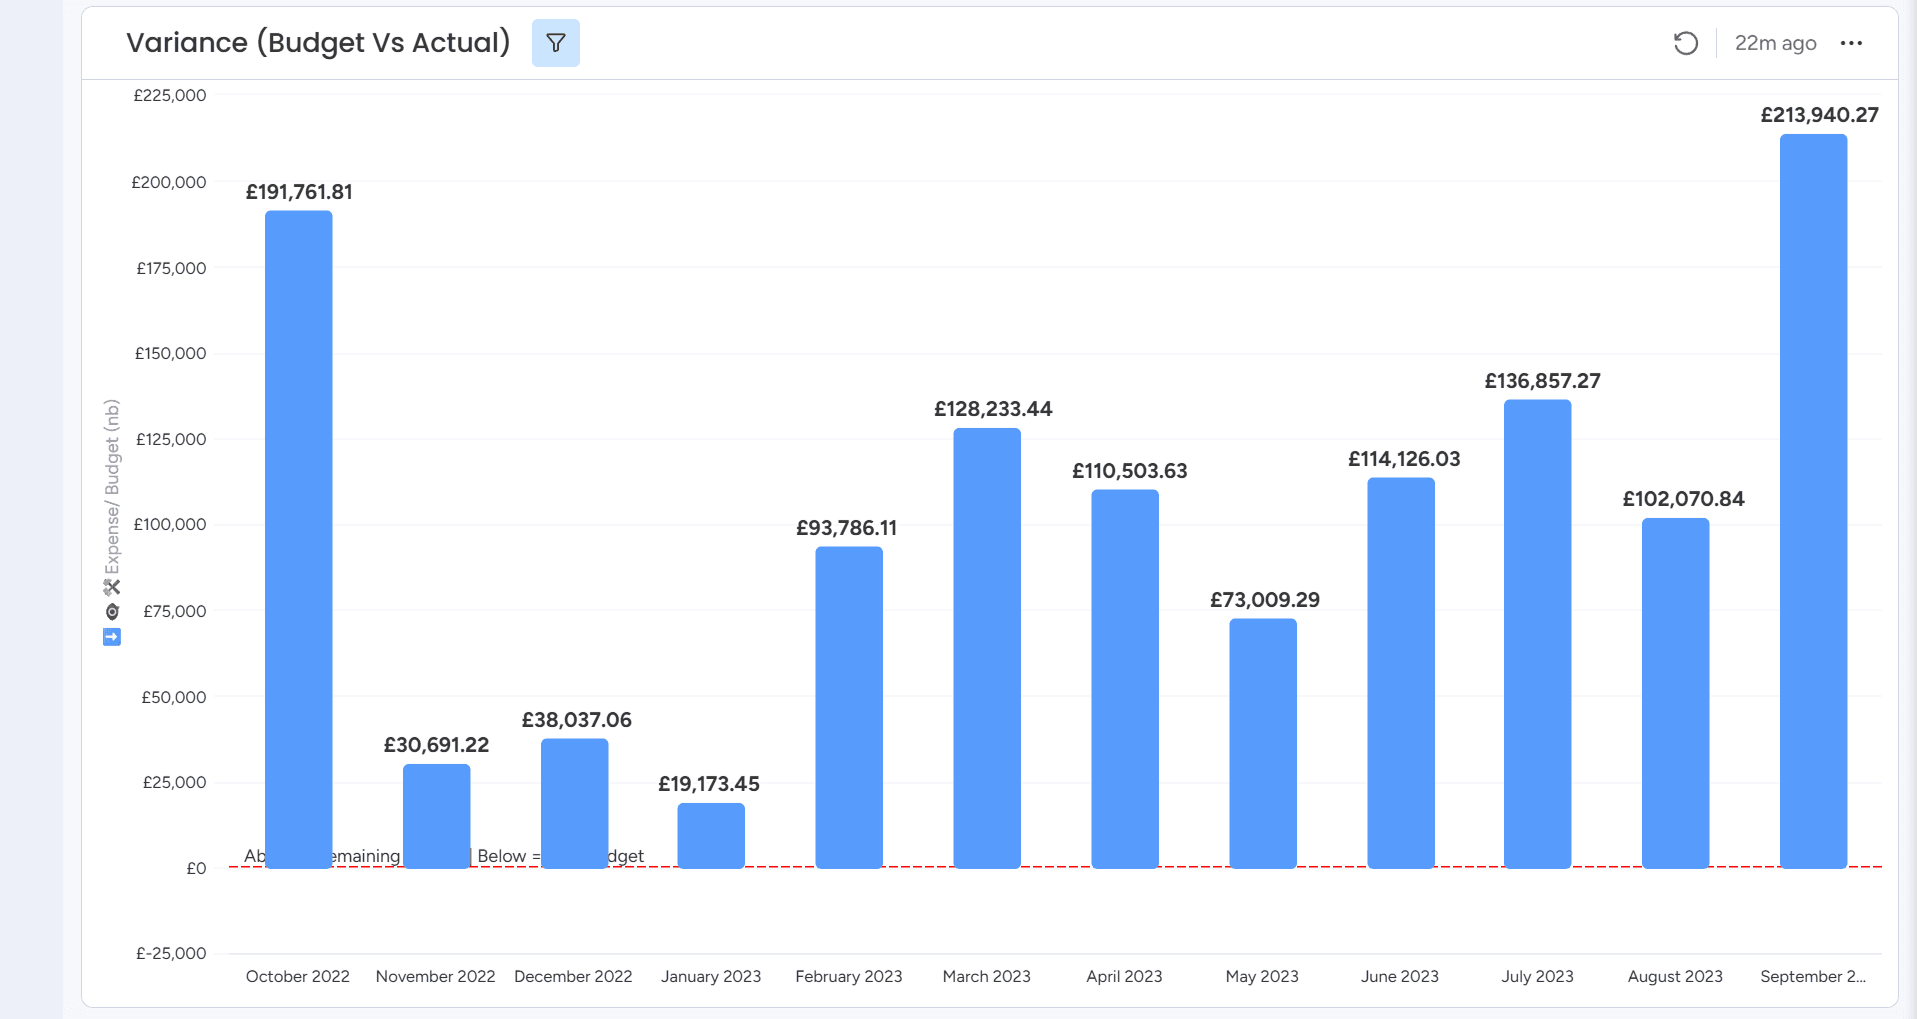
This bar chart displays the monthly variance between budgeted and actual spend from October 2022 through September 2023. Positive values represent underspend (remaining budget), supporting clear visibility into financial performance trends and highlighting months with significant cost savings or close budget alignment.
Tags
FinanceDashboardKPICost Analysis