

Budgeted vs Actual Spend per Category by Month (YTD)
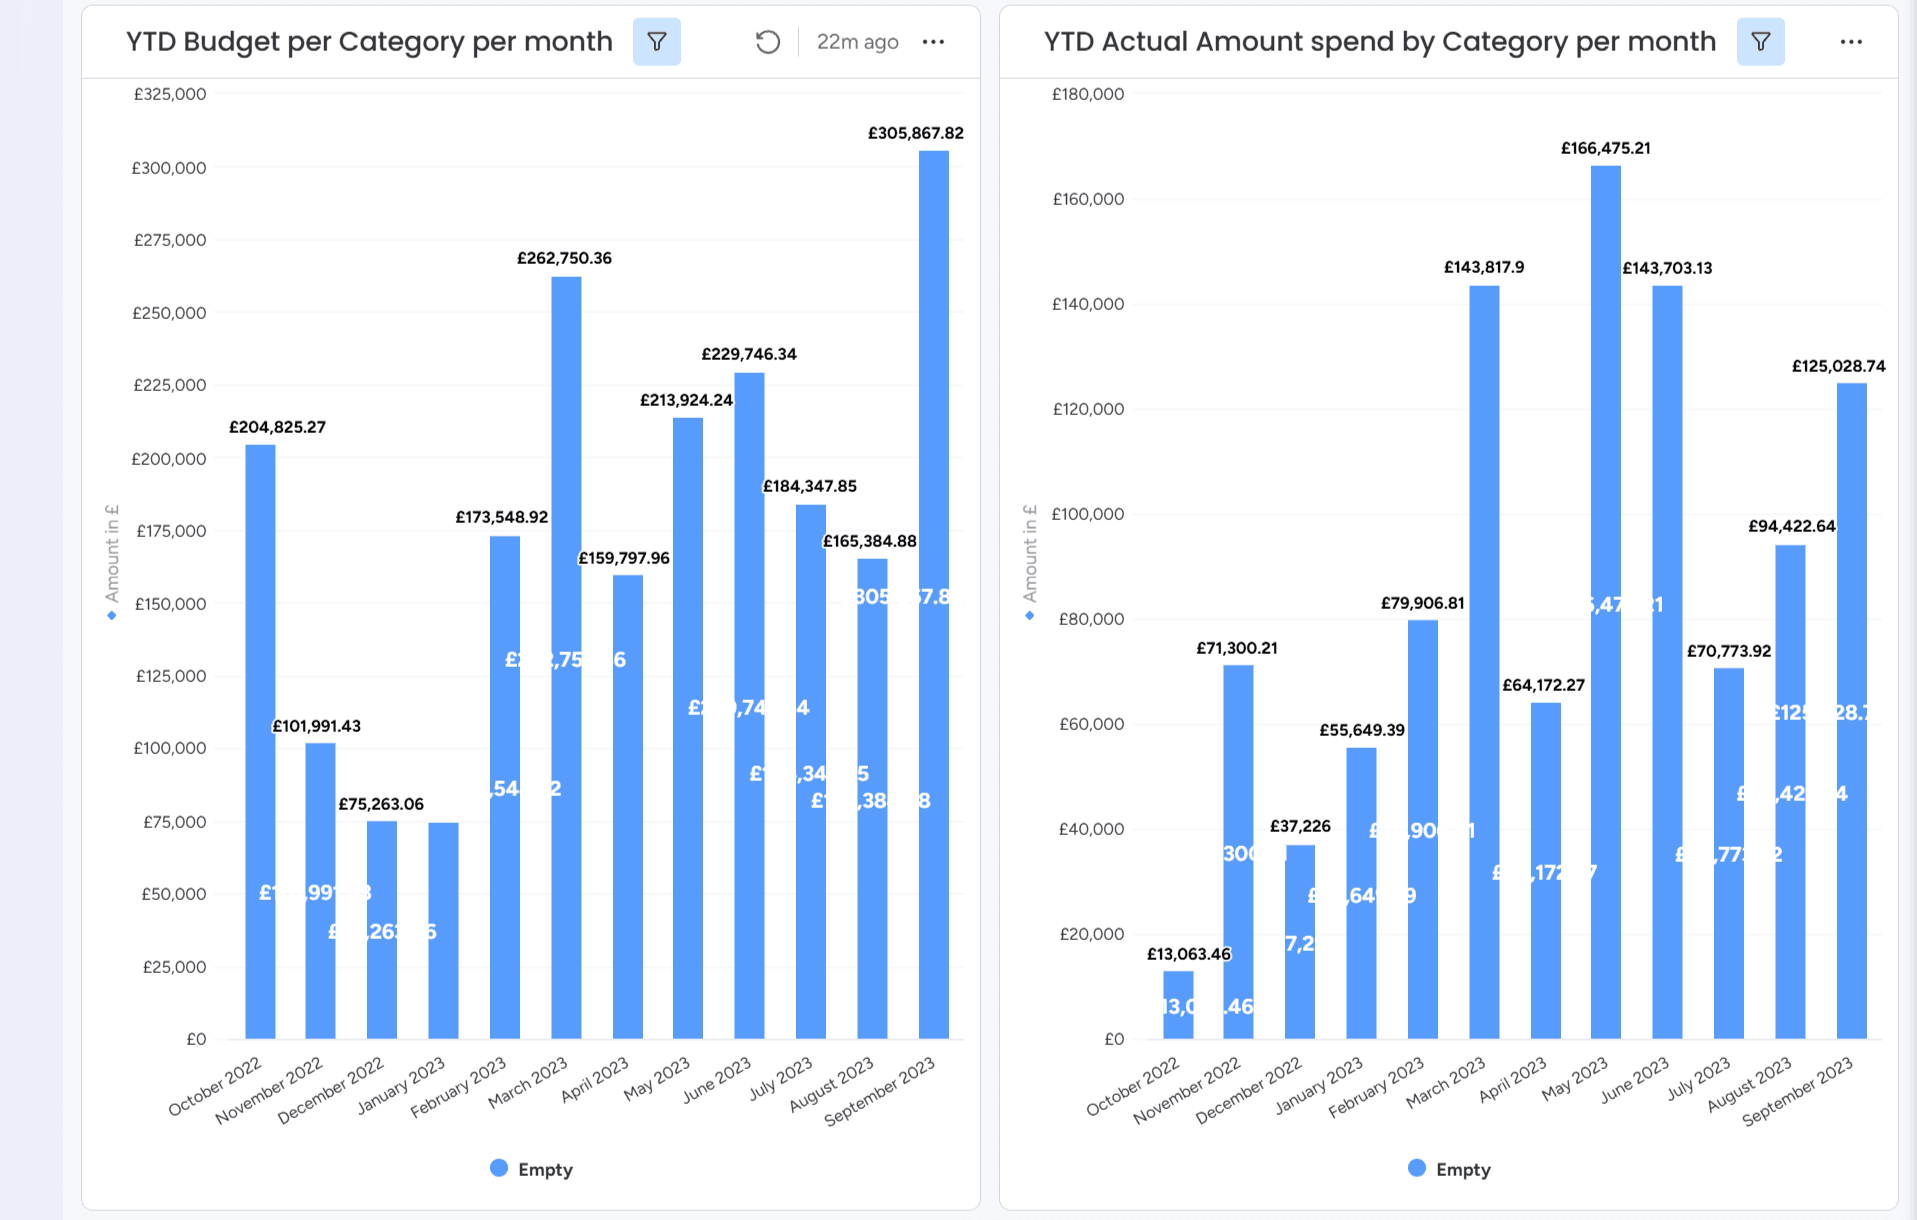
This set of charts provides a side-by-side comparison of the year-to-date budgeted versus actual spending across categories on a monthly basis. The visual breakdown highlights variances between planned allocations and real expenditures from October 2022 to September 2023, supporting financial accountability and variance analysis.
Tags
FinanceDashboardKPICost Analysis